Currency strength meter mistake you should avoid doing are:
- Mistake #1 – Not knowing how currency strenght meter works
- Mistake #2 – Using only currency strength meter signal to enter into the trade
- Mistake #3 – Not using strength of other currencies into calculation
- Mistake #4 – Trading strong currency against strong currency
- Mistake #5 – Using new currency strength meter on live account
- Mistake #6 – Using currency strength on lower time frame
Let me explain in more details each of the above listed mistakes you should avoid when using currency strength meter.
#1 Mistake: Not Knowing How Currency Strength Meter Works
First currency strength meter mistake is trivial one. Would it be nice to know how the meter works so you know it shows correct values and so that you know is there logic in calculating the currency strength?
Yes. That would be nice.
This mistake is important to avoid because if you calculate currency strength on a weekly time frame using 10 last weeks compared to the results you get using the last 50 weeks you will have different results.
The 10 week market overview is different compared to market status in the last 50 weeks. The strength of the currency changes easily.

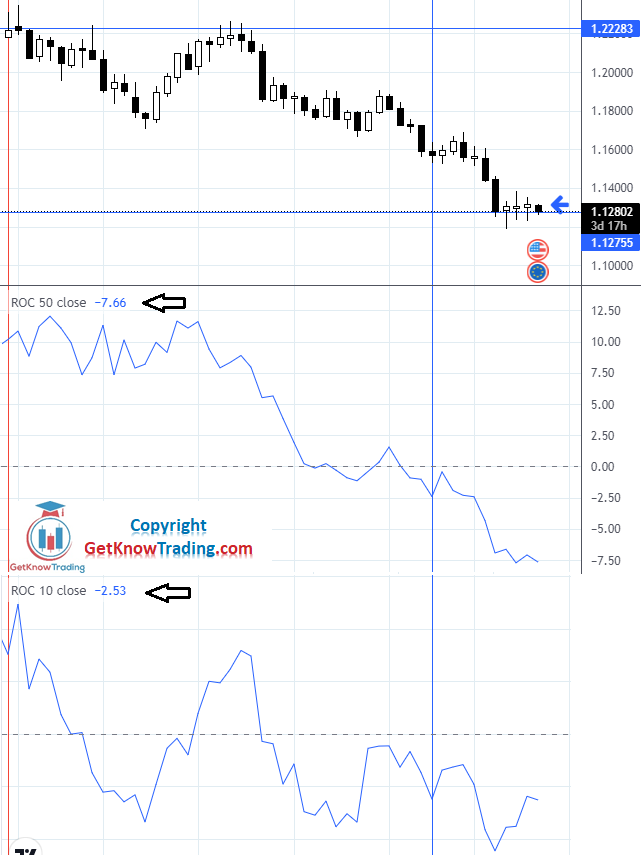
What you can see in the image above is two different ROC values. First one is for a 50 week period and the second one is for a 10 week period.
The ROC calculation compares the current price with the price “n” periods ago.
In the case of the 50 week period we have a current price 7.66% weaker than 50 weeks ago. That means the price has lost its value almost 10%.
In the case of a 10 week period we have a current price 2.53% weaker than 10 weeks ago. That means the price has lost its value.
What you can see there are two values, -7.66% and -2.53%. So, if you compare these two values today with other currencies you will have different currency strength.
If you take -7.66% you will have weak currency, but in reality the strength of the currency is closer to -2.53% than -7.66%.
That is why it is important to know which time frame is used to determine the strength of a currency compared to other currencies.
Currency strength meter must use fresh values and that on a weekly time frame around 10 weeks at most which is equal to 2.5 months.
If you use a daily time frame then 50 daily candles would be the maximum you should use in your calculations.
Weak vs Strong Currency Example
Now I will show you another example of a currency strength meter when you have a signal that one currency is strong and one is weak.
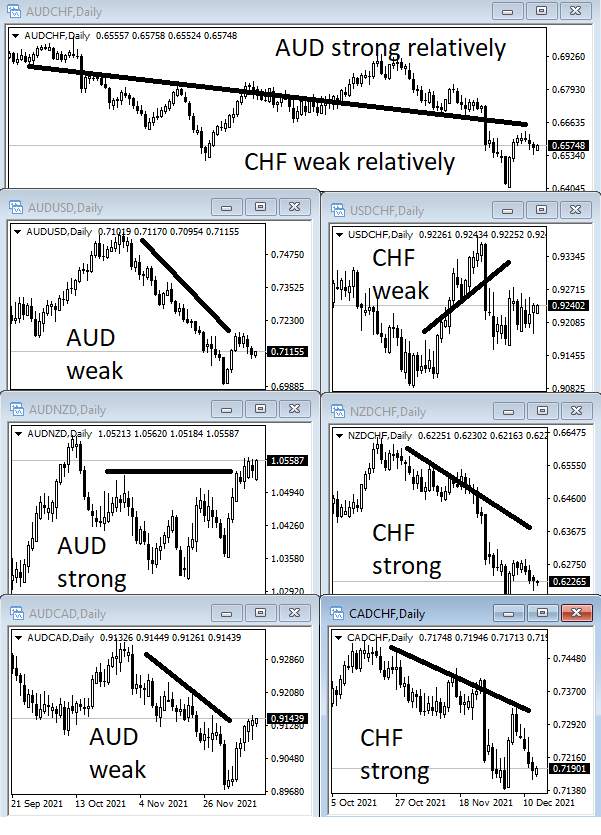
Below is an image that shows you what I mean. You have one strong currency, AUD, and one weak currency CHF.

When you combine charts of the same currencies you are comparing with, then you can see what this means.
You see that AUD/CHF shows you that AUD is weak against CHF. And this chart is on a daily time frame.
But, the currency strength meter shows the opposite case. AUD should be strong and CHF weak.
Now, take a look into other charts where they show AUD weak, and CHF strong. This means the currency strength meter shows an incorrect signal.
You see you cannot rely on the currency strength meter on its own without knowing which time frame he is showing the results. Maybe he shows the weekly time frame strength of the currency and you are watching the daily time frame. As in the chart’s examples.

#2 Mistake: Using Only Currency Strength Meter Signal to Enter Into the Trade
This currency strength meter mistake should always be avoided when trading with a currency strength meter because relying only on the strength of currencies calculated by the CSM is not a good option.
Imagine you see USD strong which is 10% stronger than other currencies, and EUR which strength is 1% compared to other currencies.
And you open the Sell order on EURUSD because those two currencies are totally on the opposite side. EUR is the weakest and USD is the strongest.

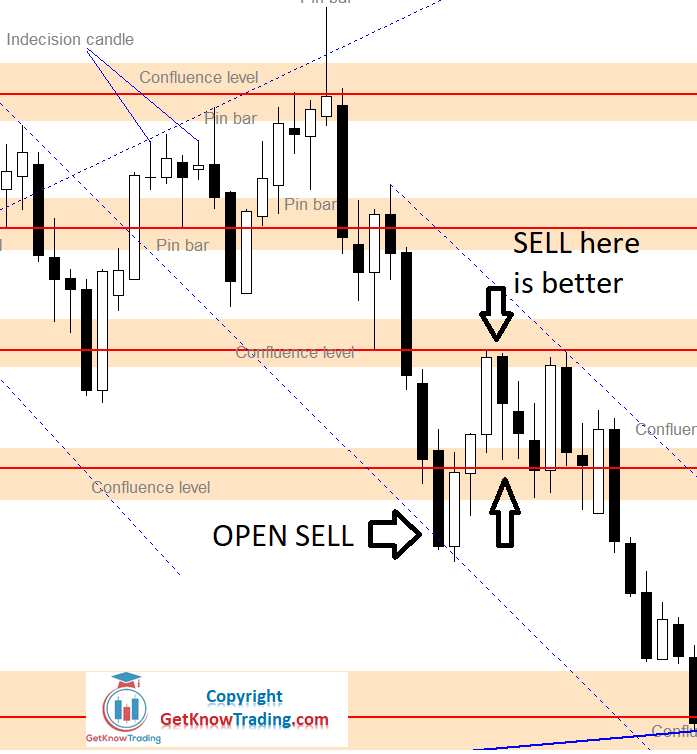
If you take a look in the image above where EUR is weak and USD is strong the value of a currency pair will go down.
The arrow that shows the SELL entry is the place where you decide to open the sell order. And what do you see on the chart? Is it a good time to open a sell order?
Maybe you think it is because it is in the open space between horizontal support/resistance lines. And that is a valid opinion.
But, the price in the next few days returned back up after it broke below the support line. And then moved up to the first strong resistance.
From there the price returned down and continued moving below entry level. And this resistance area would be a great entry level for sell. And the USD strength would not drop in value in these few days when the price returned up so the signal would be still valid.
This means opening an order only on buy/sell signal from the currency strength meter is not a good option.
What you should do is to back up the trading signal from the currency strength meter with some other technical tools. Support/resistance, channels, and trend would be great option to back up the signal.
Using more tools to confirm currency strength meter signal would increase the accuracy of the trading signal that would help you be more profitable.
#3 Mistake: Not Using Strength of Other Currencies Into Calculation
This currency strength meter mistake is really simple to explain and to understand because the logic behind this mistake is this:
- you see EUR is the strongest currency and you start opening buy orders on all EUR pairs
Well, this approach will not give you the best results. And the reason is that, some other currencies like USD, GBP or similar could also be very strong.
Maybe EUR is the strongest, but it does not mean EUR will beat USD or GBP if they are also strong.
To prevent this mistake happening to you, you should have a list of all currencies strengths and see which currency is the strongest.
If EUR is the strongest then you should look for the weakest currency to trade against. That way you increase the chance of probability you will make money trading EUR.

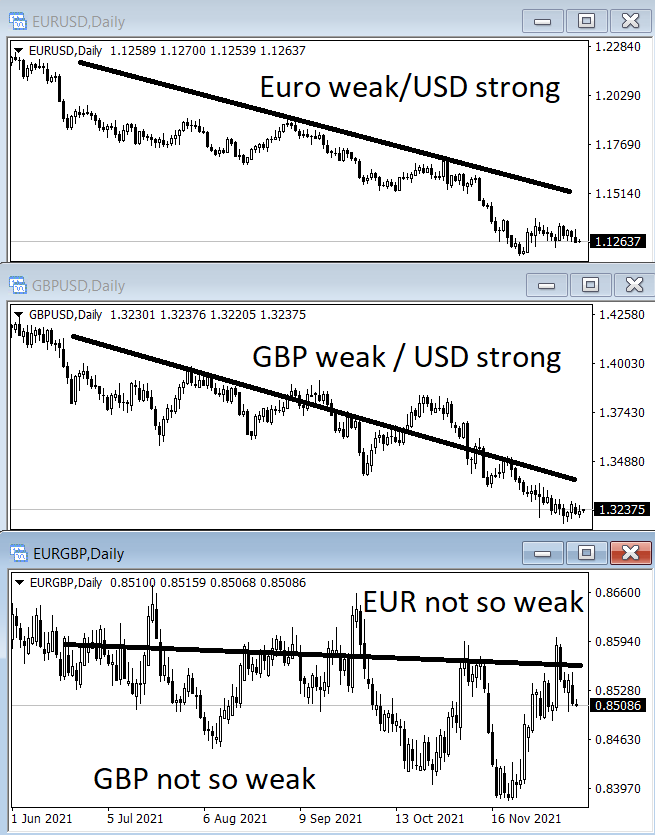
Look into the image above.
What you see is the current status of three currency pairs.
First chart shows you EURUSD where the Euro is a weak currency and USD is a strong currency.
Second chart shows you GBPUSD where GBP is a weak currency and USD is strong currency.
Third chart shows EURGBP where EUR and GBP have almost the same strength.
Now, what you can conclude here is that EUR on average is not so weak and GBP is not so weak. Maybe USD is strong against these two currencies, but it does not mean EUR and GBP are the weakest on the market.
For example, if the EURGBP chart would show EUR very weak and price decline similar to EURUSD then we would say USD is strong and EUR is weak.
The goal is to use other currencies into calculations to get a better picture of one currency strong against all other currencies and only against one.
#4 Mistake: Trading Strong Currency Against Strong Currency
Now I will show you an example of how to not trade when you have a signal that one currency is strong and the other one is strong.
Currency strength meter shows that EUR and GBP are strong currencies. So the logic says not to trade them against each other.
And the reason is that because both of them are strong currencies and I cannot take this information in advantage to trade profitably.

If I decide to trade EUR against GBP then I would get a case as on the third chart where EUR/GBP pair is.
The average price movement is a horizontal line that tells me EUR or GBP does not win in the battle. The price is moving sideways if we look on average.
Sometimes the price goes down and sometimes goes up. If you want to trade this pair you would need to catch swings on support and resistance and hope the swing will bounce from those lines.
To be on the safe side you should watch for the currencies that are strong and weak and trade one against other.

#5 Mistake: Using New Currency Strength Meter on Live Account
This currency strength meter mistake is something that you should pay attention to.
Not using a currency strength meter on a demo account first is a mistake to avoid in any case.
You should verify that a currency strength signal about a certain currency gives a good signal about the currency strength.
To validate that you should use the currency strength into trading analysis and see does the signal comply with your analysis. After that you should check the results you get.
Did the currency strength signal point you in the right direction or on average the currency strength signal was a false signal.
You should test the signal on different time frames to get better results and to see how it behaves on a 4H, daily, weekly time frame.
With the results you will see when to use and when not to use currency strength meter signals.
#6 Mistake: Using Currency Strength on Lower Time Frame
Any analysis you make on low time frames, 1min, 5min, 15min, 30min, 1 hour gives a lot of false signals.
Any indicator will give more false signals than correct signals on average. Currency strength meter is also trading indicator that gives false signals so pay attention when using it on lower time frames.
Lower time frames are influenced by the news and short spikes on the markets so they give bad signals on the short term period.
If you use a currency strength meter signal on a lower time frame be prepared that you will have a lot of bad signals. Currency strength meter uses a small number of candles on lower time frames to calculate the strength.
When the calculation is done the signal is valid for a short period of time. And if there is a spike on the market that spike will influence the signal.
You should avoid using currency strength meters on lower time frames. And that means lower than daily time frame.
Daily time frame gives you a more reliable signal because it takes 50 candles, on average, to calculate the currency strength.
With 50 daily candles short daily spike because of the news will not affect the currency strength. That way you will have a more steady signal which you can use in trading analysis.
Conclusion
To summarize this topic I suggest you use a higher time frame when using currency strength meters to avoid bad signals.
Select strong currency and find weak currency and then trade strong against weak currency to get better results.
Avoid trading strong currency against strong currency because you will have a hard time to guess where the price will move. And because you will increase profitability of each trade you use when trading strong against weak currency.
And final step you should pay attention to is to use a reliable currency strength meter that has accurate results that are tested on the demo account first and then on the live account.
